Debugging your AM
jFed offers some tools that can help a lot when debugging your AM.
Once your AM is running, we can add it to our fedmon monitor.
jFed Probe GUI
The jFed Probe GUI is a tool for manually calling servers. Very low level calls can be made, and low level replies are visible. This tool requires knowledge of the communication APIs, and the tool itself is not a very user friendly GUI. It can be very valuable for testbed developers that wish to debug their server.
While you can execute all calls by filling in all details manually, for convenience, the probe GUI can automatically execute user and slice related calls with minimal user input:
- Start the Probe GUI and login
- Expand “API Wrappers”
- Expand “Automatic User and Slice API Wrapper”
- Select “getLocalUSerCredentials”
- Click the big “Call” Button. After a while, you’ll see that a call was done, and it’s results will appear. This call contains the user credential. (the jFed probe has stored it and will automatically fill it in for next calls.)
Now that you have a user credential, you can use it to create a slice:
- Go to the “Automatic User and Slice API Wrapper” methods, and select “createSlice”
- In the form to the left, fill in “sliceName”, choose an expire time (2 hours by default)
- Click to check the checkbox before “subAuthName”, and fill in the EXACT name of your project as “subAuthName”. (“sub authority” and “project” are the same thing)
- Click the big “Call” Button. After a while, you’ll see that one or more call are done, and their results will appear. This last call contains the slice credential. (the jFed probe has stored it and will automatically fill it in for next calls.)
If you go to any AM call now, you will see that the slice name and credential are filled in by default.
jFed automated tester
The Automated Testing GUI: This tool is used to run tests scenarios on servers. This is only useful for server developers, and it is not a very user friendly GUI. It includes simple tests, such as veryfing if the GetVersion reply of an AM server is correct, and more complex tests, such as verifying if an AM can correctly provision a node, and if that node can be logged in to using SSH.
First start the automated tester. You can find the latest jFed releases here. Download the “jFed GUI (archive)” from that page.
After downloading the archive, extract it to a directory. Then execute automated-testing-gui.jar.
Example commands:
$ wget -nv https://jfed.ilabt.imec.be/releases/develop/VERSION/jar/jfed_gui.tar.gz
2017-01-10 11:27:28 URL:https://jfed.ilabt.imec.be/releases/develop/VERSION/jar/jfed_gui.tar.gz [25654644/25654644] -> "jfed_gui.tar.gz" [1]
$ tar xfz jfed_gui.tar.gz
$ cd jfed_gui
$ java -jar automated-testing-gui.jar
NOTE: Replace VERSION in the command above with a jFed version. You can find a link to the stable version at https://jfed.ilabt.imec.be/downloads/ or you can pick a development version at https://jfed.ilabt.imec.be/releases/develop/?C=N;O=D
You can also use the installer, and install the automated tester that way.
When you start the automated tester, you need to log in with your user account.
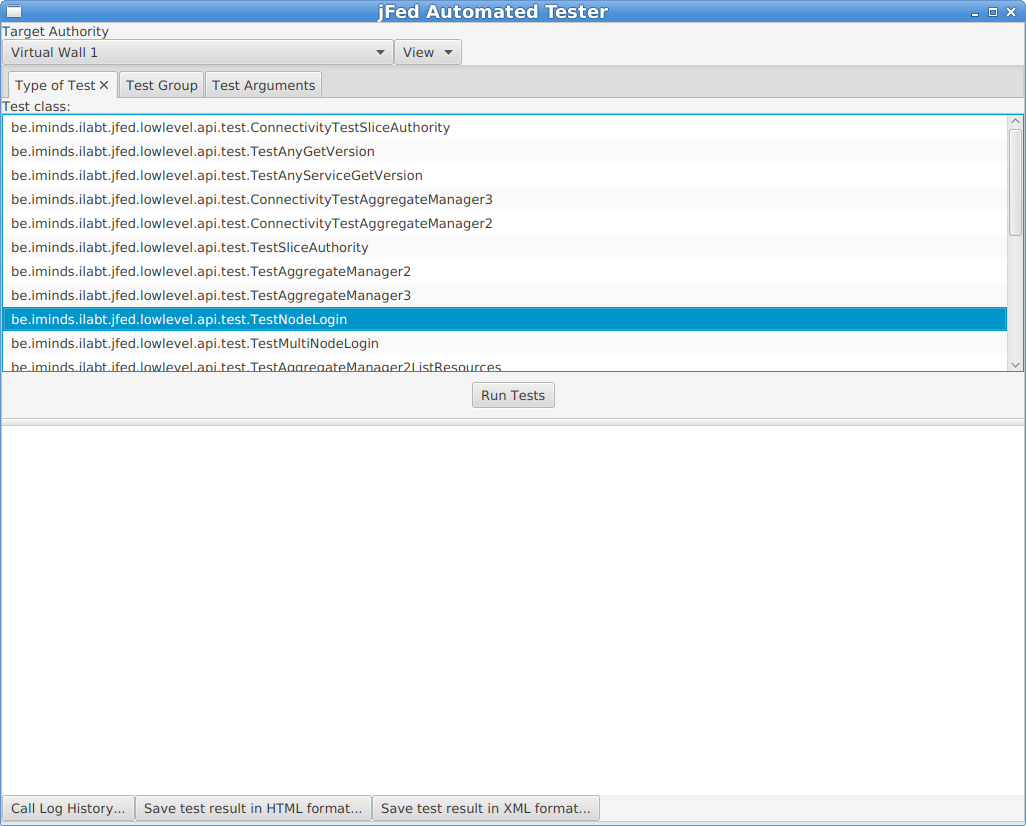
On the next page, you need to select the testbed you want to test, and the test you want to run.
In the example below, we are testing the “Virtual Wall 1” testbed. The chosen test is “TestNodeLogin”.
This test will create a new slice at the logged in user’s authority. Then it will contact the tested testbed, it will execute Allocate and Provision calls, wait for the nodes to become ready, and then try to log in to the nodes.
Finally, no matter wether the tests fails or succeeds, a Delete call is made to free any resource reservations.
When the testbed (“Target Authority” at the top of the window) and the test are selected (in the “Type of Test” tab), you can optionally go to the “Test Arguments” tab. This tab lists all possible options for the tests. For a lot of tests, these are a lot of options, and they are undocumented. For the “TestNodeLogin”, you typically do not need to change anything. Some interesting configuration options are:
fixed_rspec: You can specify a custom RSpec here, if the automatically generated RSpec is not ok.fixed_rspec_url: You can specify the URL to a custom RSpec here, instead of entering the Rspec directly as with thefixed_rspecoption.
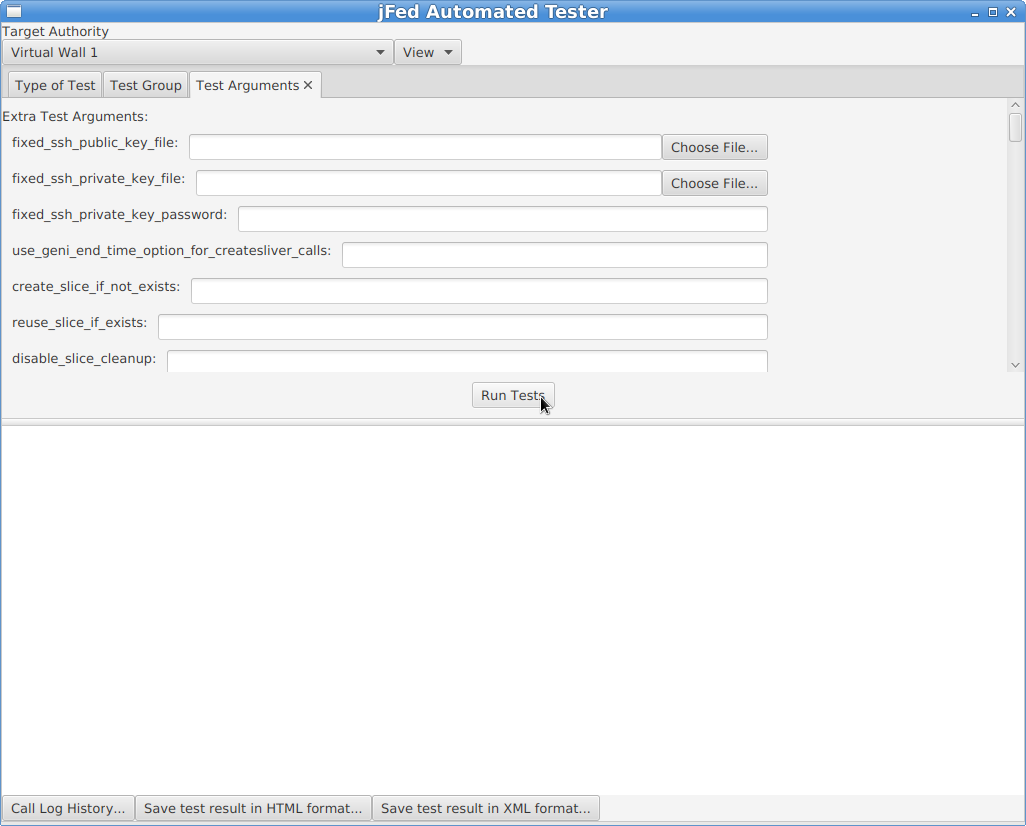
Next, click on the “Run Tests” button. You will see a progress bar while the test runs. A “TestNodeLogin” can take a few minutes, to more than 20 minutes, depending on how fast the AM is, and wether the nodes come online or not.

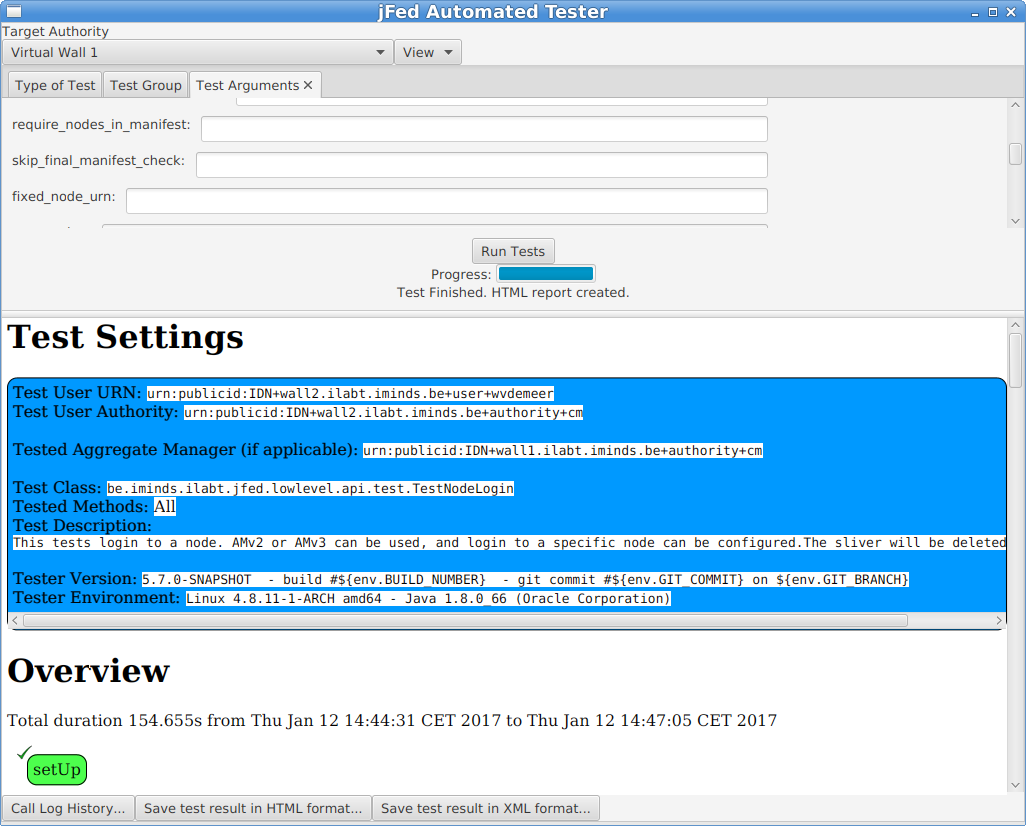
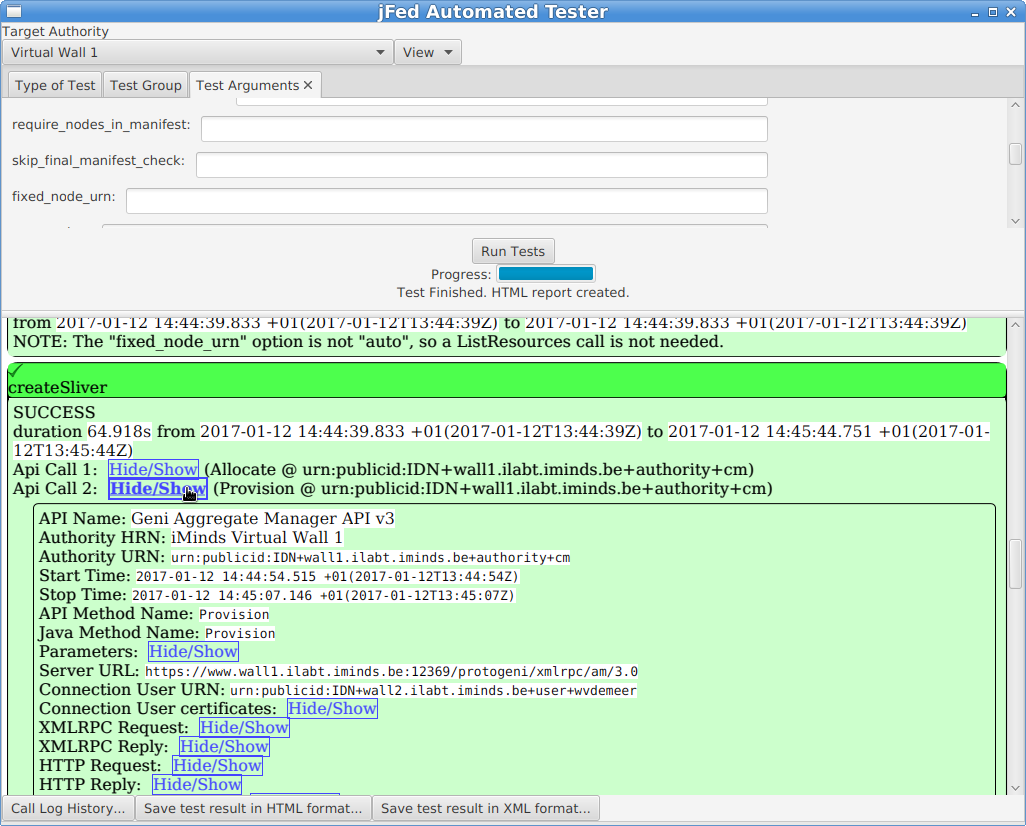
A test report will appear in the bottom half of the window when the test is finished. You can look into the details of each step. Note that you can click the “Hide/Show” buttons to show additional call details.
At the bottom of the window, there are some buttons of interest:
- The “Call Log History” button allows you to see the call details in the same way as the jFed probe shows them. This is sometimes easier than the HTML view above.
- You can use “Save test result in HTML format” to store the result to disk, which can be handy to send them to others.
Permanent monitoring: Fedmon
The jFed team can add your AM to the “federation monitor”. Ask us about this.
As an example, here is the monitoring overview for all monitored imec/iMinds testbeds: https://flsmonitor.fed4fire.eu/fls.html?testbedcategory=iMinds&showlogintests